
You can find r/place on Google, but that link might still work when you're reading this.
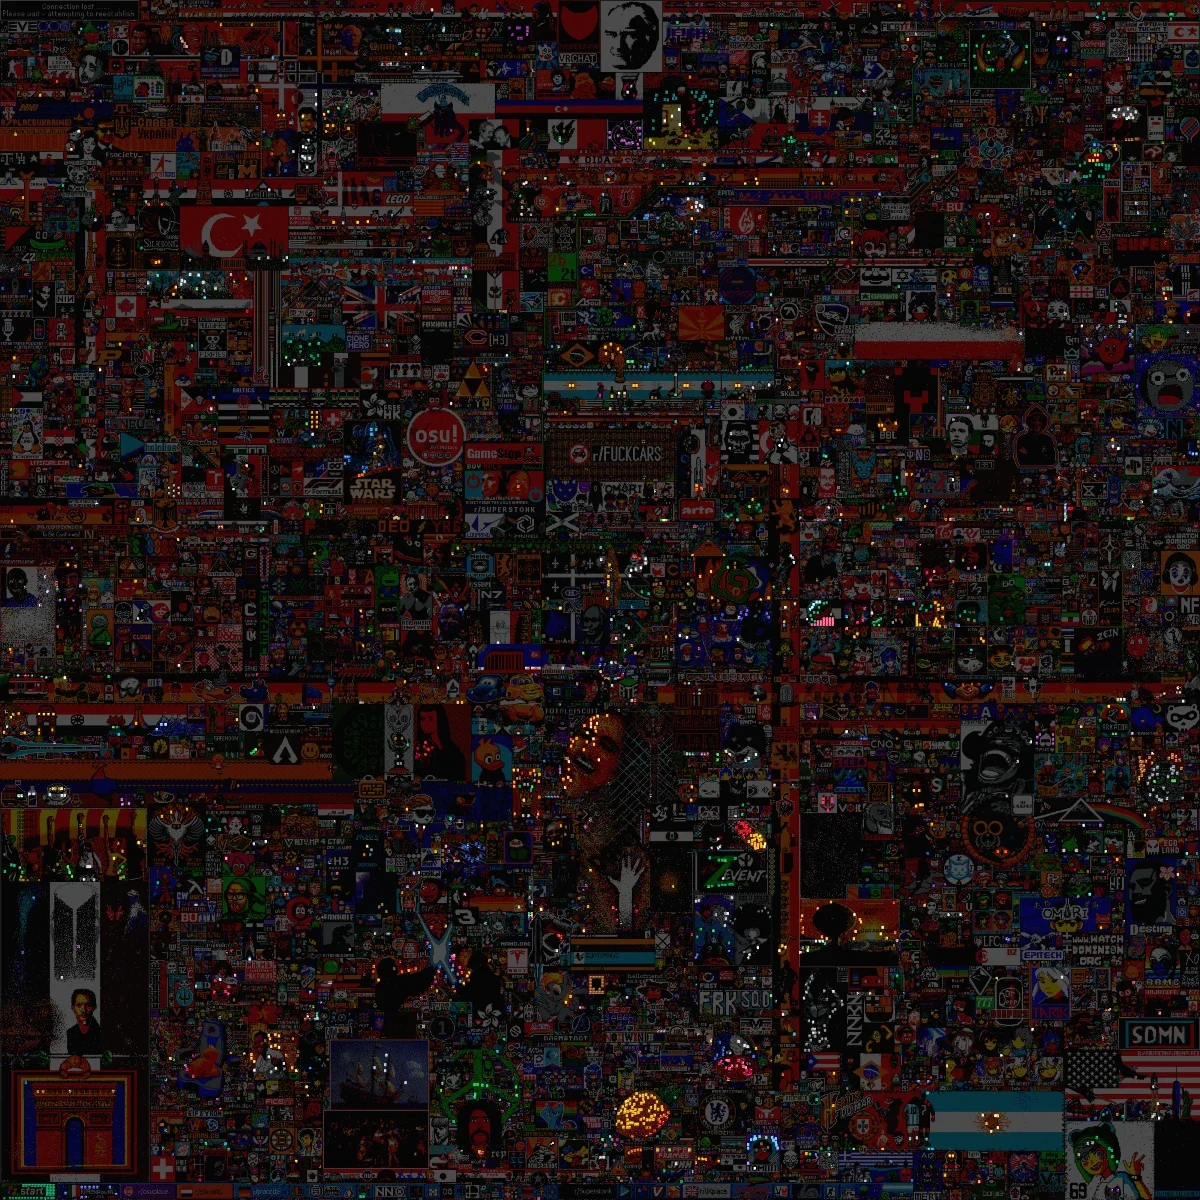
For 4 days people would place pixels on a growing canvas. Essentially at the end there was a giant 2000 by 2000 pixel canvas, with 10 million participants. Among the artworks were some sneaky impostors. I've circled three in pink here. They're only 5x4 pixels, and can be any colour. So most images have one or two hidden. I wanted to find them all. Not just in one frame, but across the entire 4 days.
I had a small idea of where to start. I knew that images are essentially just 3D arrays: width by height by 3 colours (4 for transparency). And NumPy was a library that can process matrices.
My first approach was pretty bad. I essentially did the following:
for x in range(width):
    for y in range(height):
        for colour in all_colours:
            if image[x:x+w, y:y+h] == impostor[colour]:
                # save a location
I timed one run, and if I actually let it do its thing, this would go on for 102 hours. Not very useful. Probably faster to do it manually at that point, since there were 4 different shapes they could be, with 2 orientations (left or right).
After some reading, I found OpenCV useful, and that took it down to 10 minutes per template. Still not too good. I found out about CuPy, but that didn't really solve my issue.
 Click to enlarge
I read some more, and found out about vectorization. Essentially I needed to make every function a mathematical operation. No for loops. I could split the image into 5x4 pixel chunks with one operation, as_strided(), then multiply those windows by a series of masks. I could then run some simple logical and, or, xor, etc. and get a 2000x2000 boolean array back. With CuPy, this image here took 1.6 seconds to create. Way better than 102 hours! If you're wondering, that's 2158 impostors.
Now time to find all the impostors in the entirety of the place dataset. While I didn't use the 22 GB CSV file provided, I found a compressed Parquet file with the same data. Much easier to work with.
I started with pandas, and later learned about Dask. I played with the data for a while, but again, for loops were too slow. I came across the function .pivot_table().
Using it, I could partition the data into chunks of 10 minutes, then take those 10 minutes of data and arrange them into a 2000 by 2000 pixel grid. Then run my finder function on it, and create a frame of data that showed all the impostors! And with some frame repetition and fading, we have a total of 42476 impostors!
The GIF has 501 unique frames, each repeated 3 times while fading to create the effect. The total time, including reading the 106 million line dataset, repartitioning it, processing, running the algorithm on 501 frames, creating the GIF and saving to a file: 52 minutes. These libraries are amazing.